Broadcast graphics at CBC
A story at a time: the news, the graphic I made for it, and where it ran at CBC. Built to a deadline that could be 15 minutes.
- Client
- CBC
- My role
- Broadcast graphics, Digital Desk, three years
The story
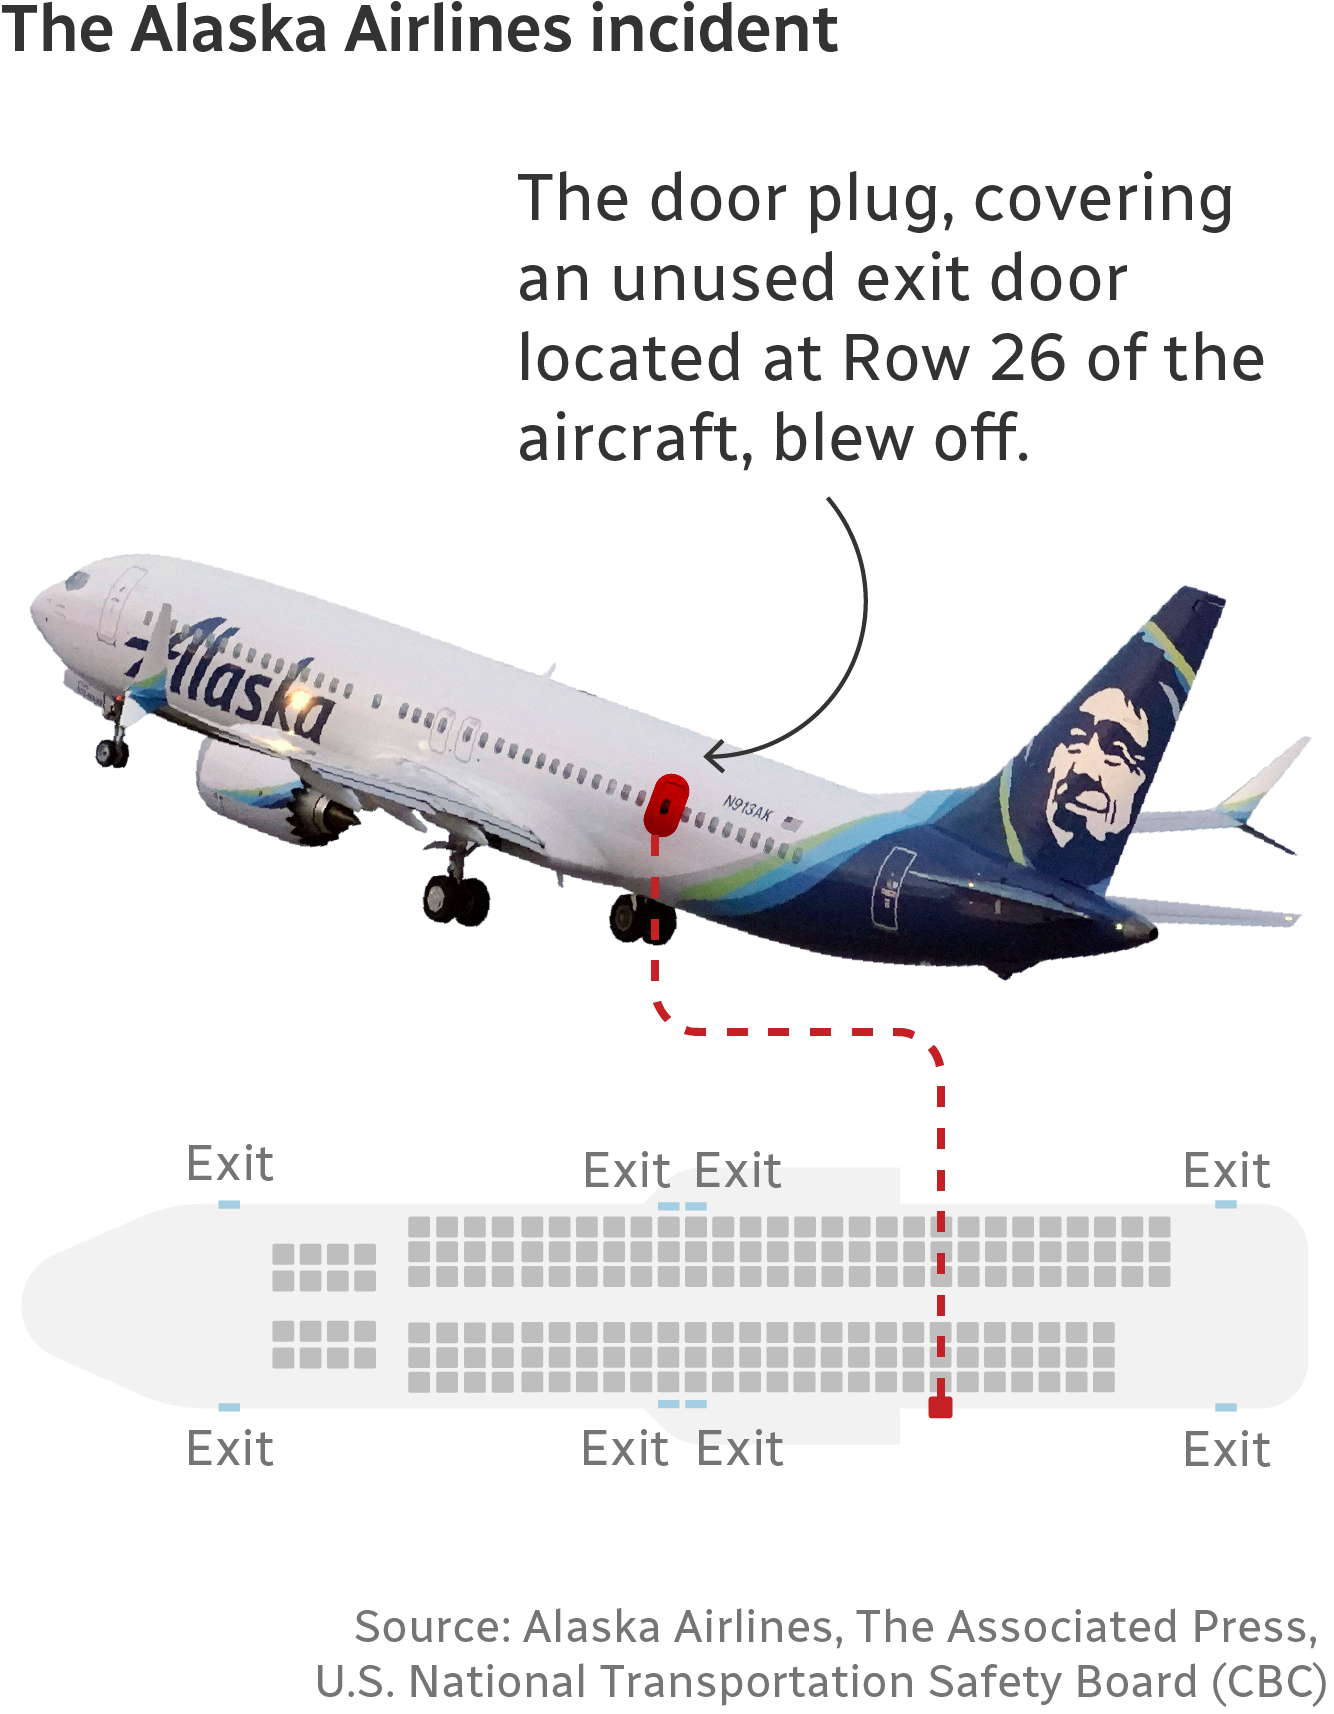
A door plug, which covers an unused exit door at Row 26, blew off an Alaska Airlines Boeing 737 Max 9. CBC needed to show readers exactly where on the plane it happened.
What I made
A photo of the plane, a seat map and one red dashed line between them. You see the door on the real aircraft, then see where that seat is inside the cabin.
Where it ran
The graphic ran in the CBC News explainer on the Boeing 737 Max 9.
Read the story on CBC ↗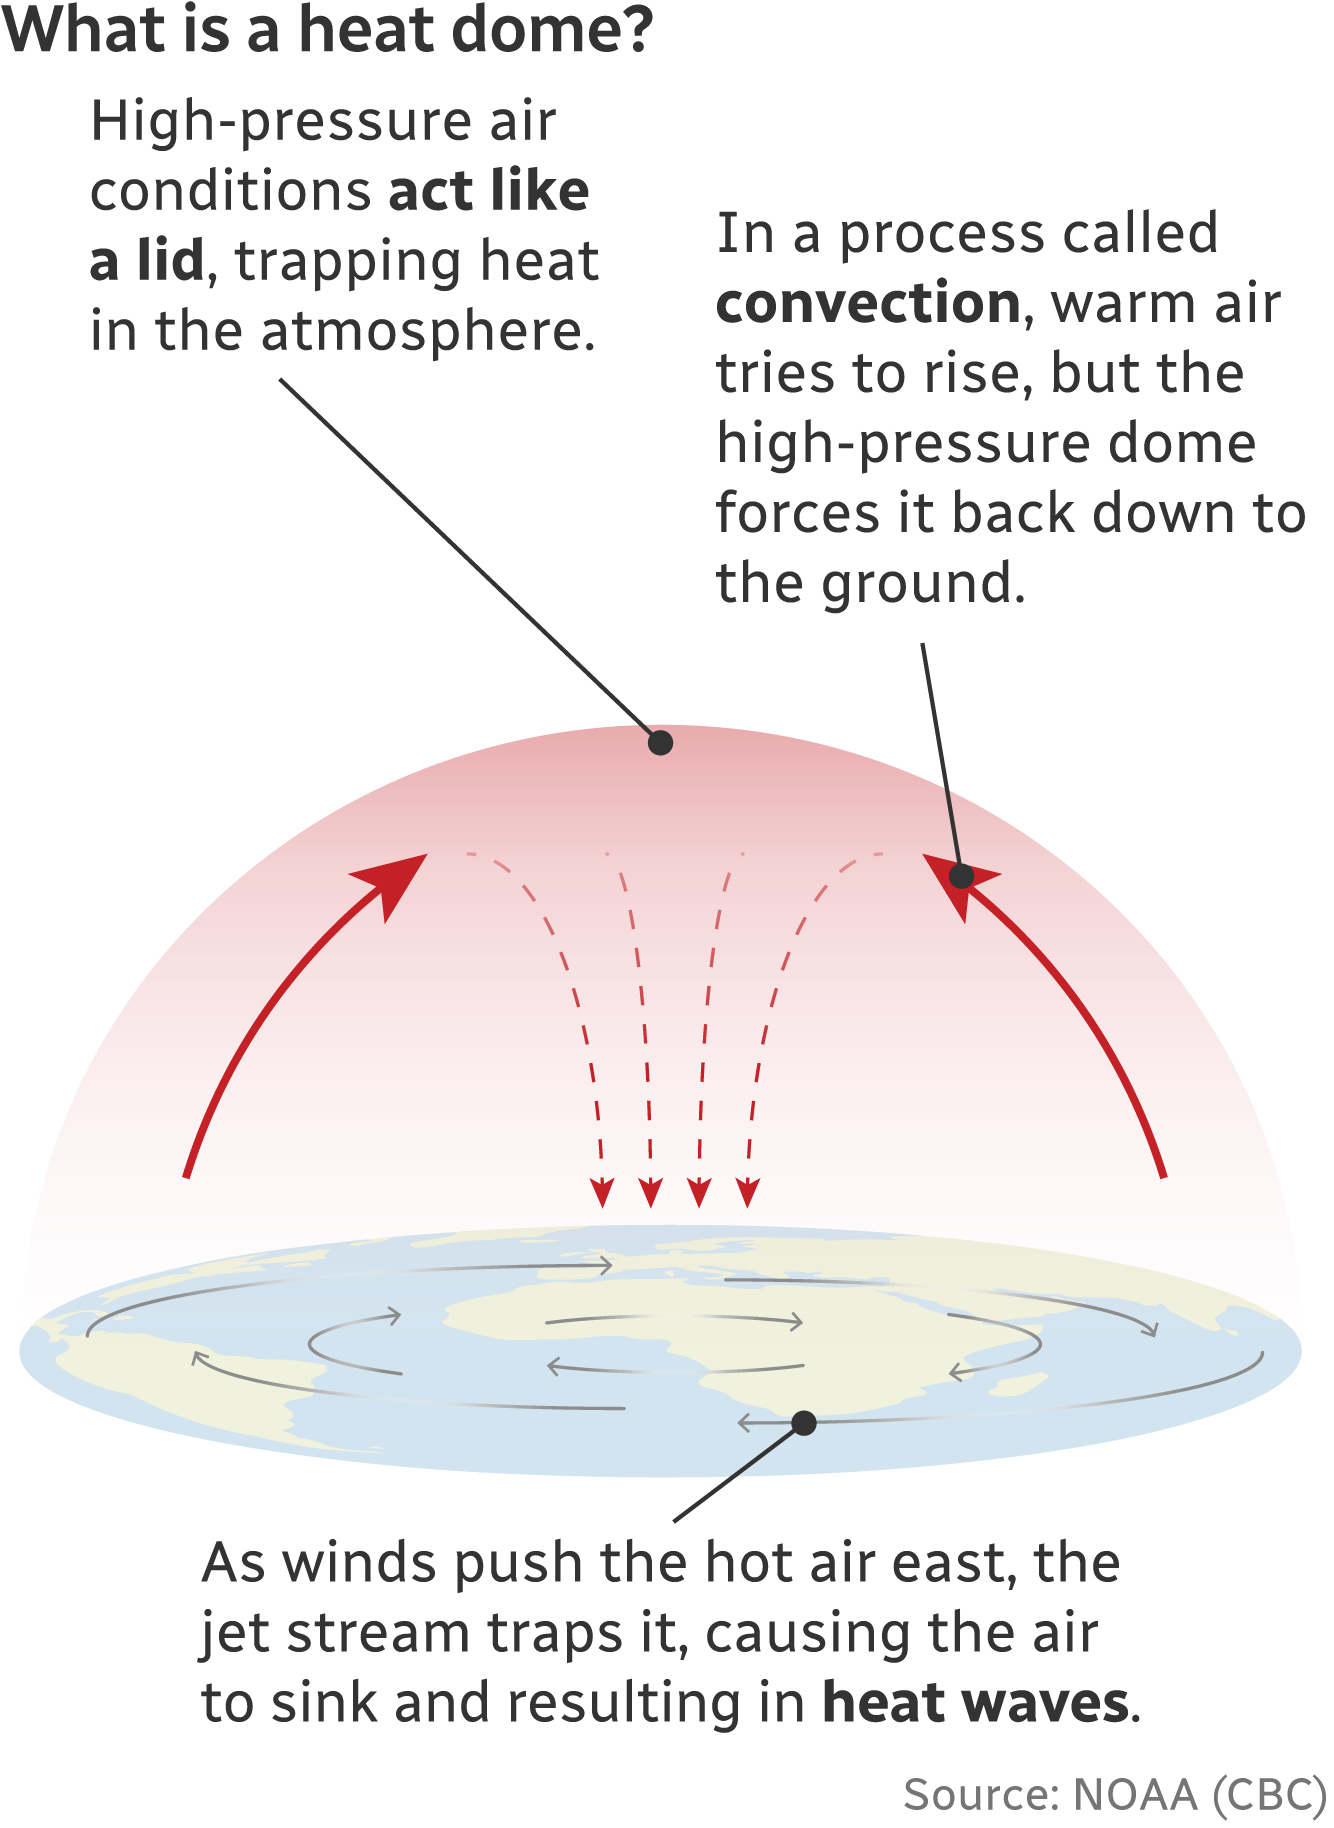
The story
When a heat wave hit Atlantic Canada in 2024, readers in places like P.E.I. were hearing the term heat dome and wanted to know what it means.
What I made
One picture of a dome over a map, with three short notes: the high-pressure lid, convection pushing warm air back down, and the jet stream trapping it. Source line included.
Where it ran
The graphic ran in the CBC story on the P.E.I. hot weather.
Read the story on CBC ↗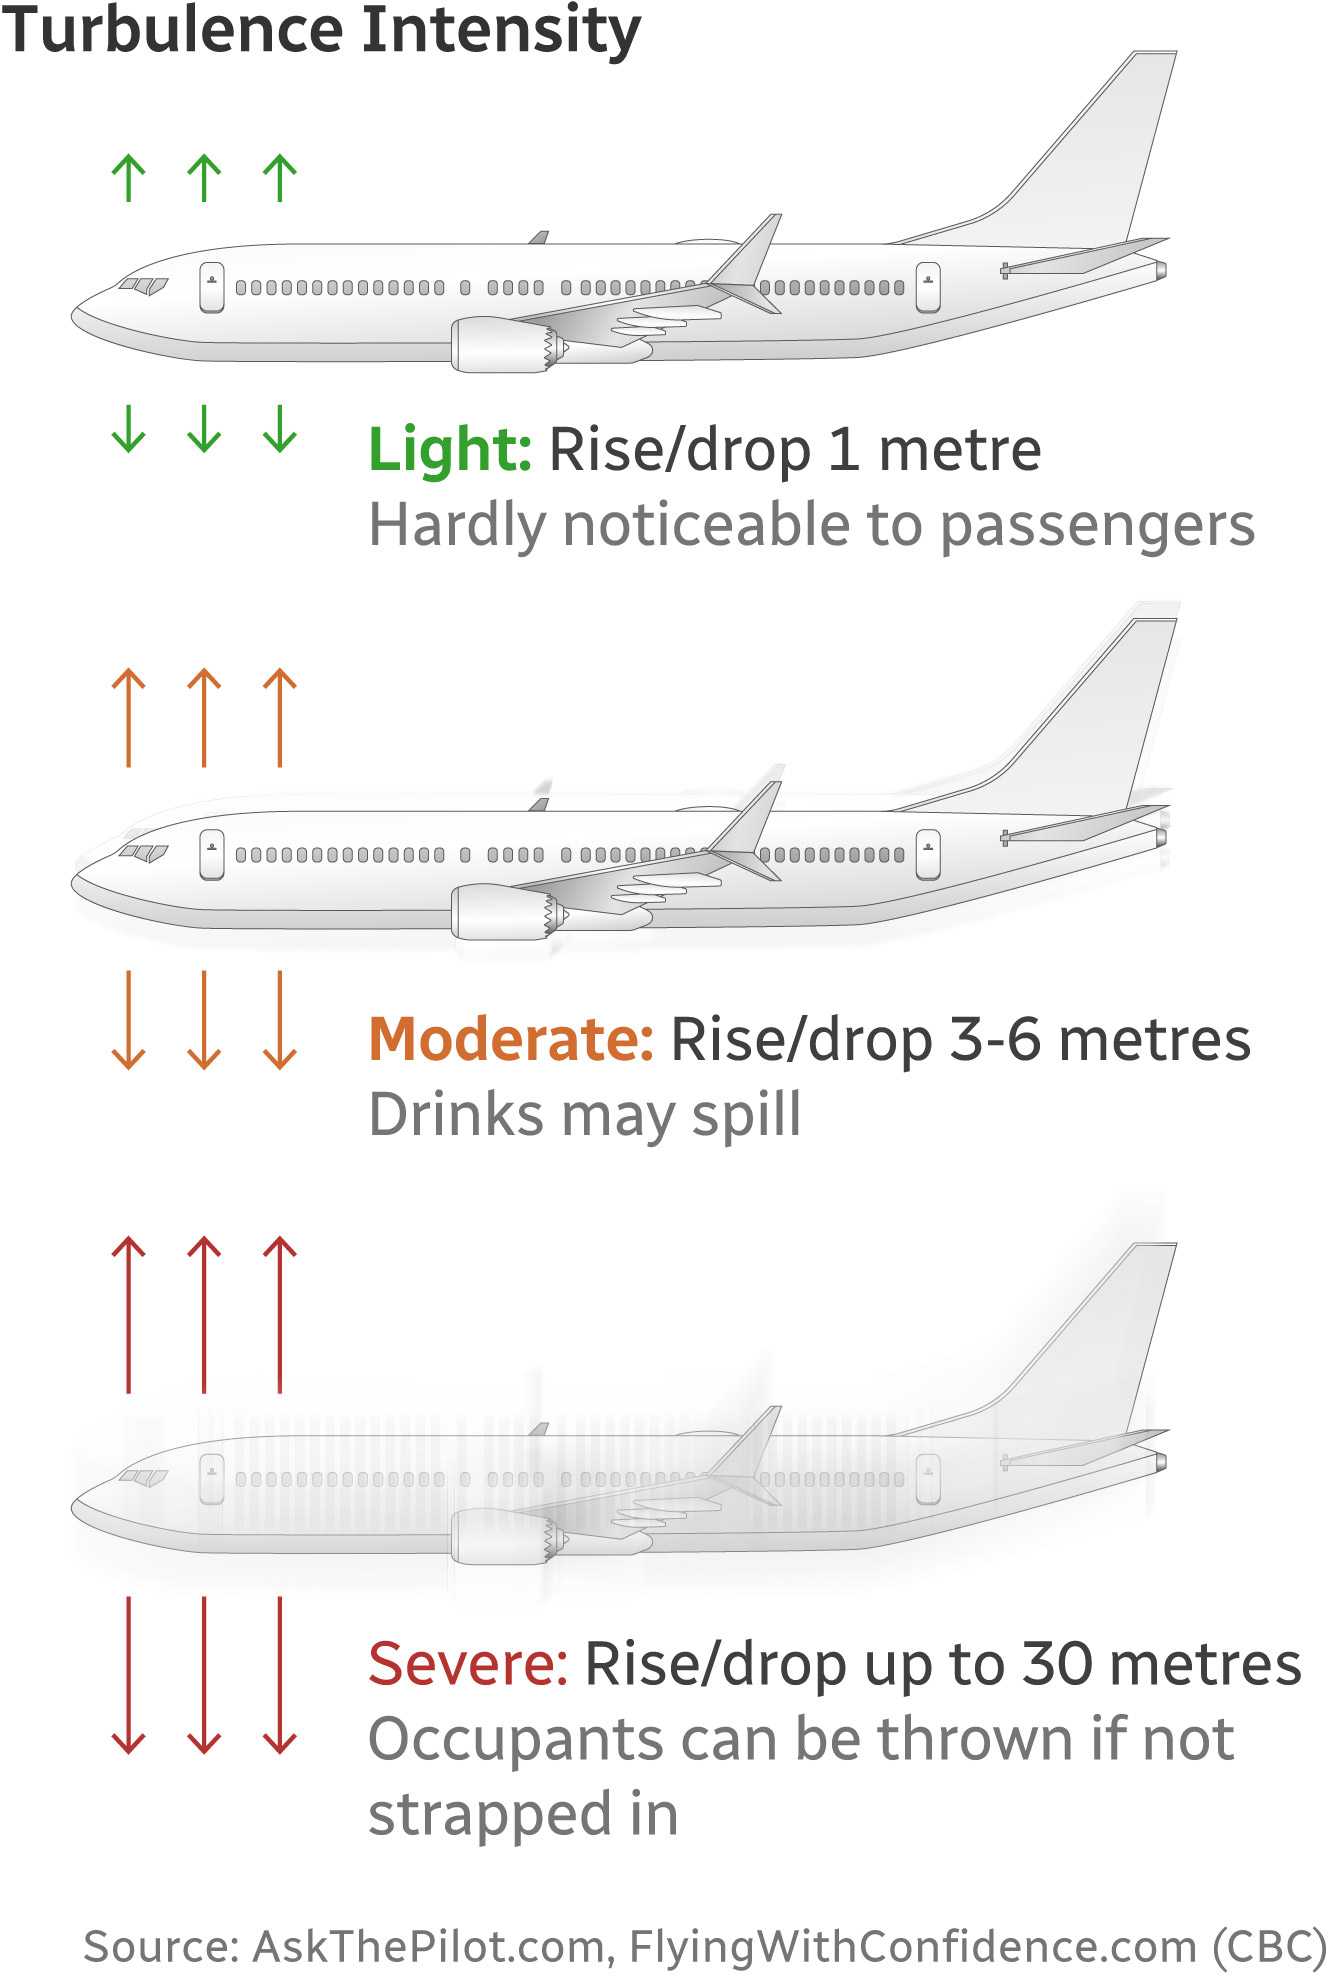
The story
After a Singapore Airlines flight from London hit severe turbulence, one passenger died and 30 were injured. Researchers told CBC that climate change is making turbulence worse, though deaths are still rare.
What I made
Three planes, one for each level. Green, orange and red arrows show how far the plane moves, and the plane itself blurs as it gets worse, so you feel the difference before you read it.
Where it ran
The graphic ran with the story on climate change and turbulence, published through Radio-Canada International.
Read the story on Radio-Canada ↗The story
Four vertical motion graphics for CBC News TikTok about winter weather: how El Nino shapes a winter, and how this year compared with the historic average for seven Canadian cities.
What I made
A globe as the stage for El Nino, with a jet stream arrow and warmer, drier and wetter zones named right on the map. Then two clean tables, this year against the historic average, with colour to show which way each number went.
Where it ran
These went out on CBC News TikTok. Press Play here to watch the posts, or open them on TikTok.
The graphics
The posts
The problem
At the CBC Digital Desk I made explainer graphics for news stories. A graphic only matters next to its story, so each one below comes with what was happening, where it ran and what it had to do. A story could break and the graphic was due in 15 minutes.
What I decided
One idea per graphic. A plain title, a short line of text for each step and a source line, so a reader gets it in a few seconds.
The same graphic in more than one shape. The heat dome had desktop, tablet and phone layouts, and the TikTok pieces are vertical 1080 by 1920 motion graphics.
Colour that carries meaning. In the turbulence graphic, green, orange and red mark light, moderate and severe, so the scale reads before the text does.
Motion only where it explains. The El Nino path and the temperature and snowfall trends move to show change over time.
The result
Each story below has the graphic, the story it ran in and the post it went out as. I do not have view numbers to share, so I am not putting any here.