Charts people write in about
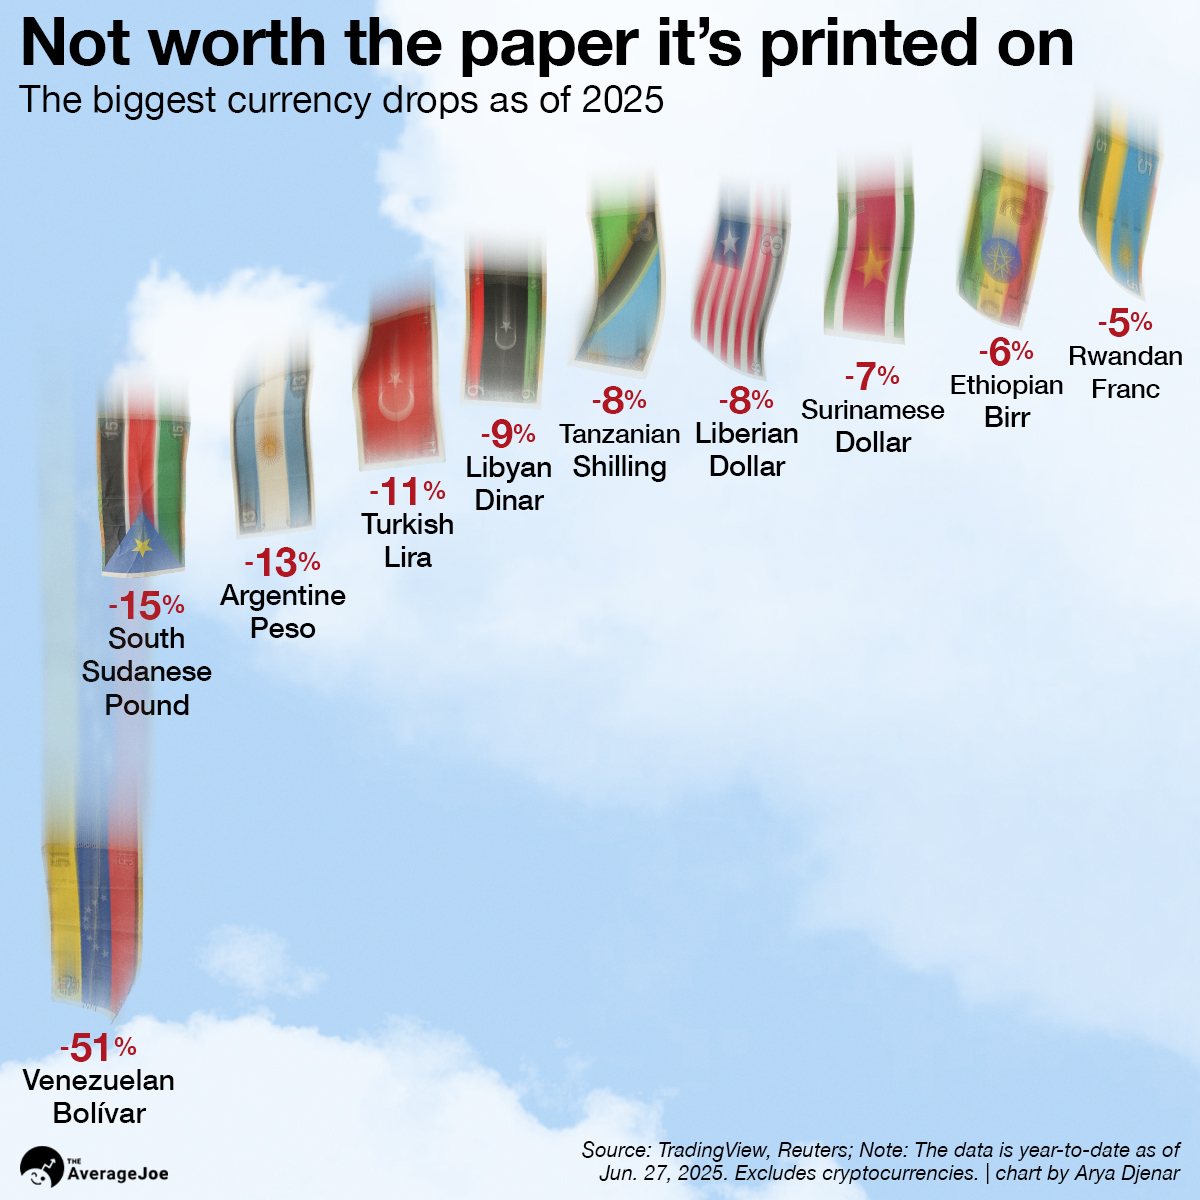
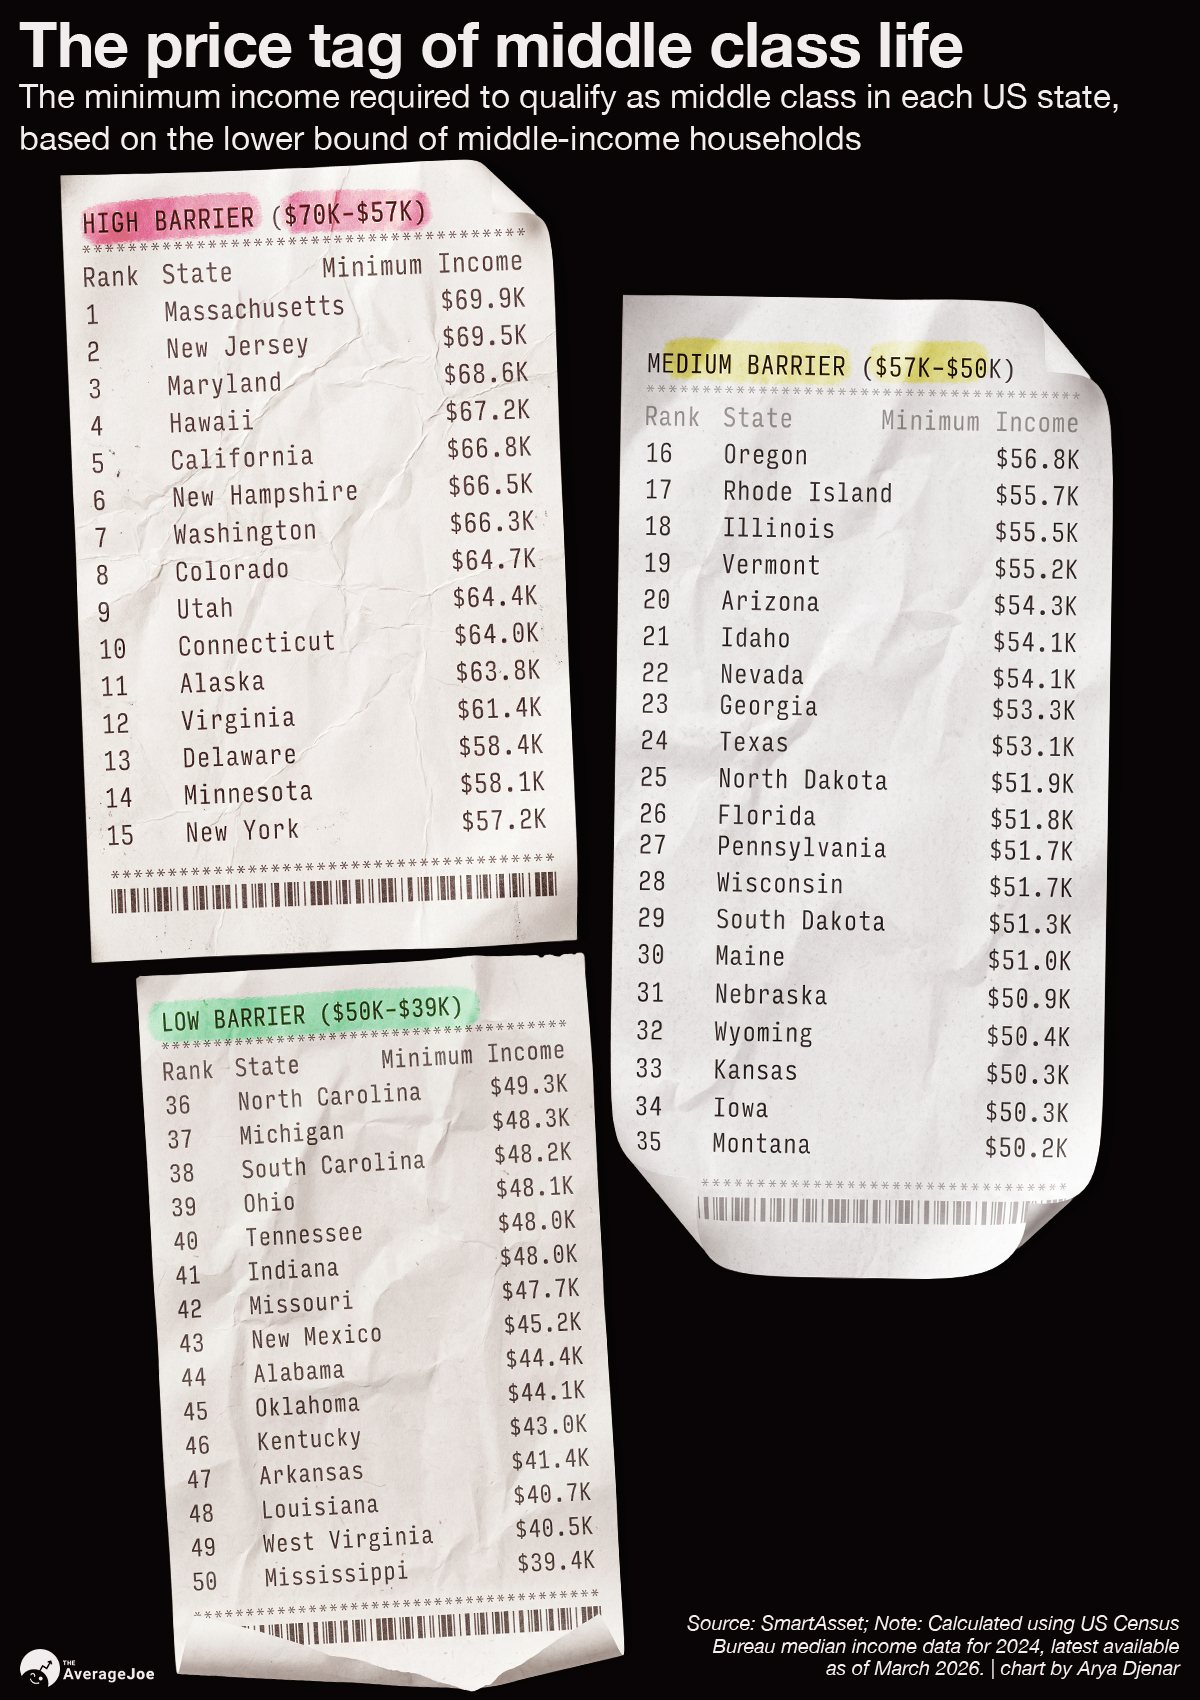
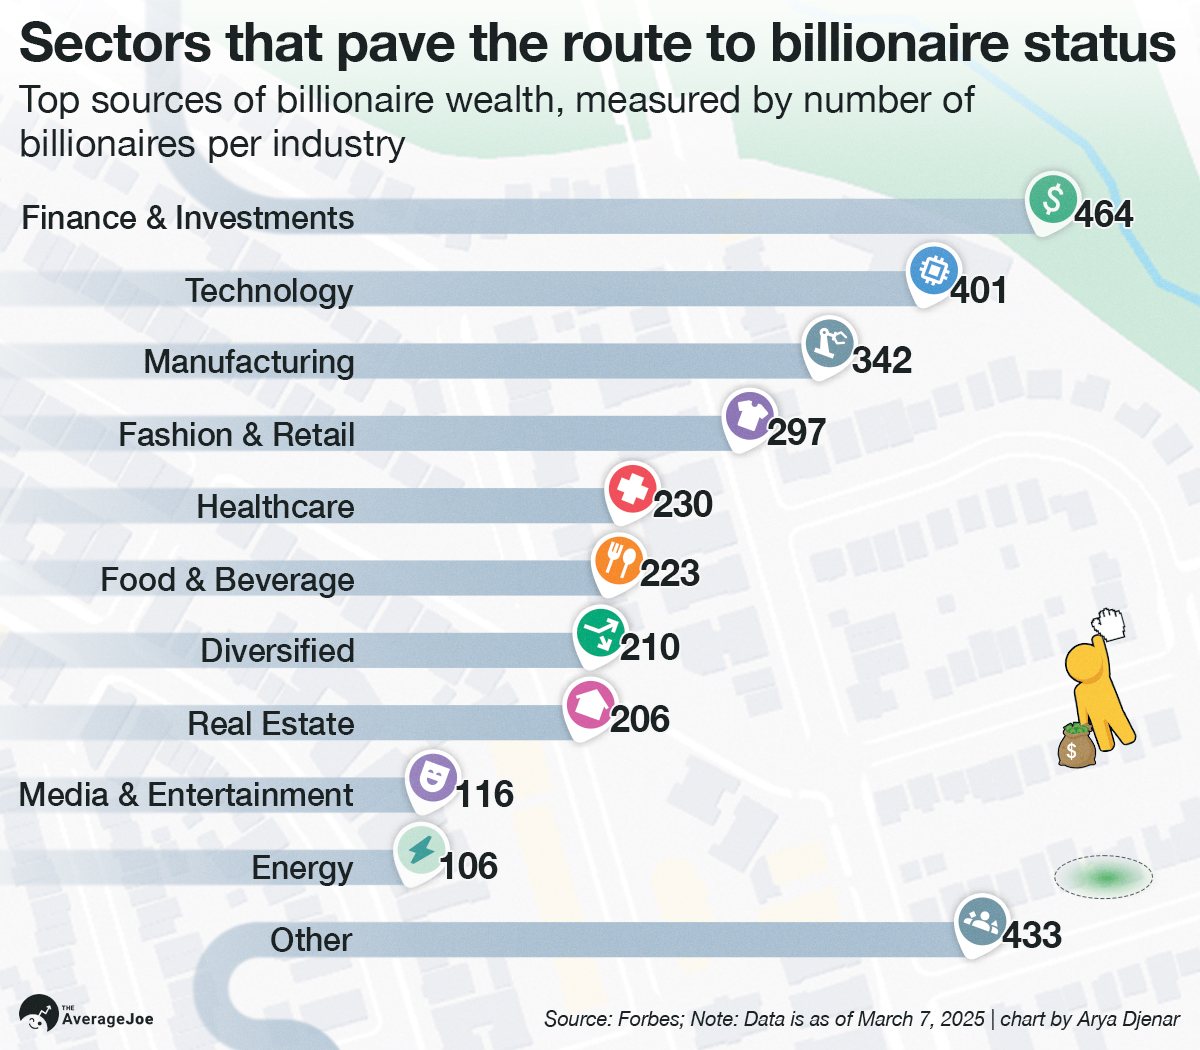
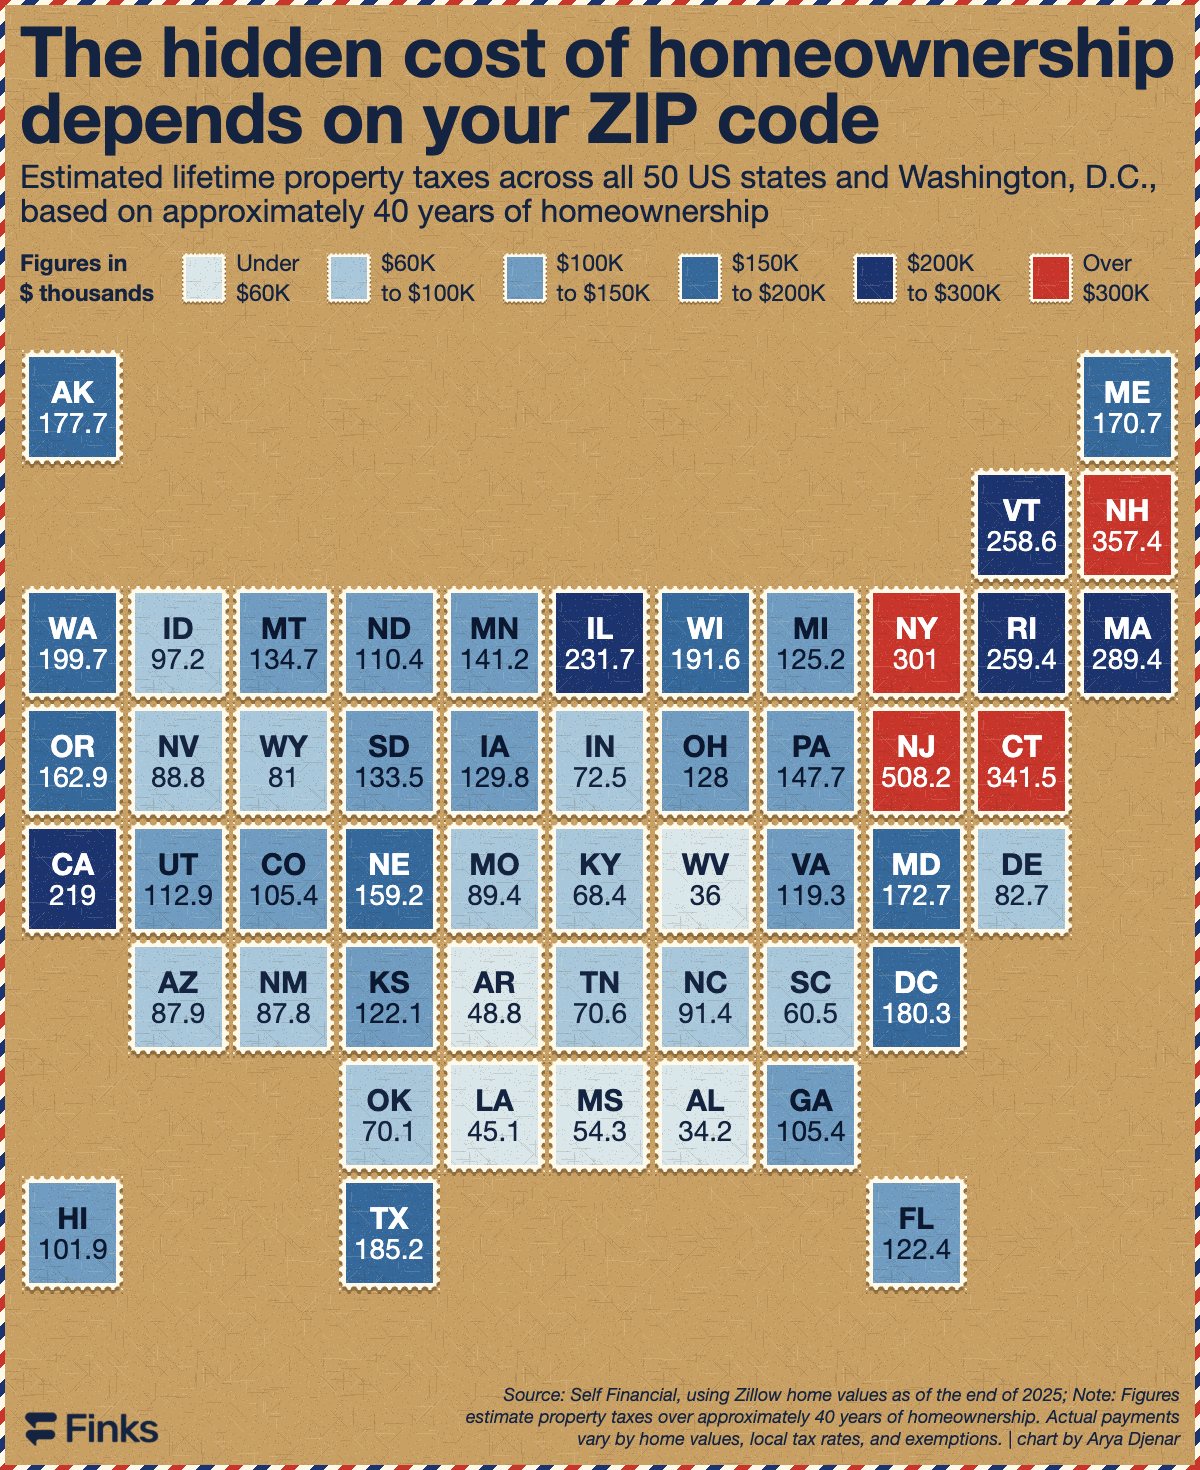
Weekly charts for The Average Joe and Finks. Each chart carries one idea, and the picture carries the message.
- Client
- The Average Joe, Finks
- My role
- Weekly chart design
The problem
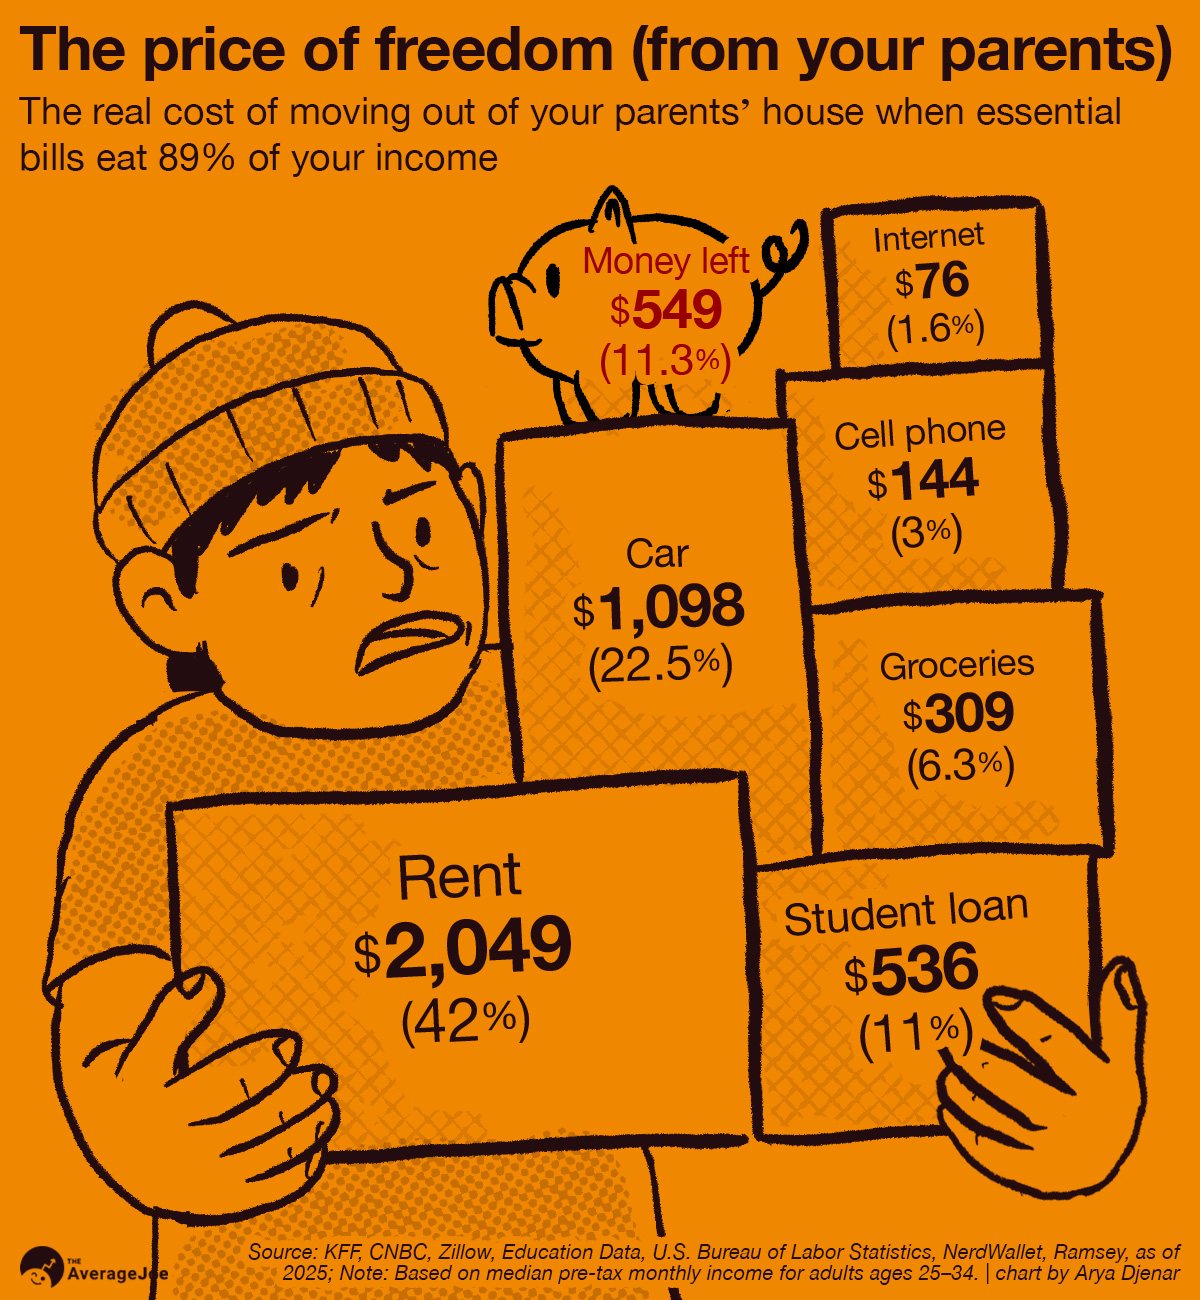
Each week a chart has to make one idea clear at a glance. It is read on a phone, in an inbox, usually in a few seconds.
What I decided
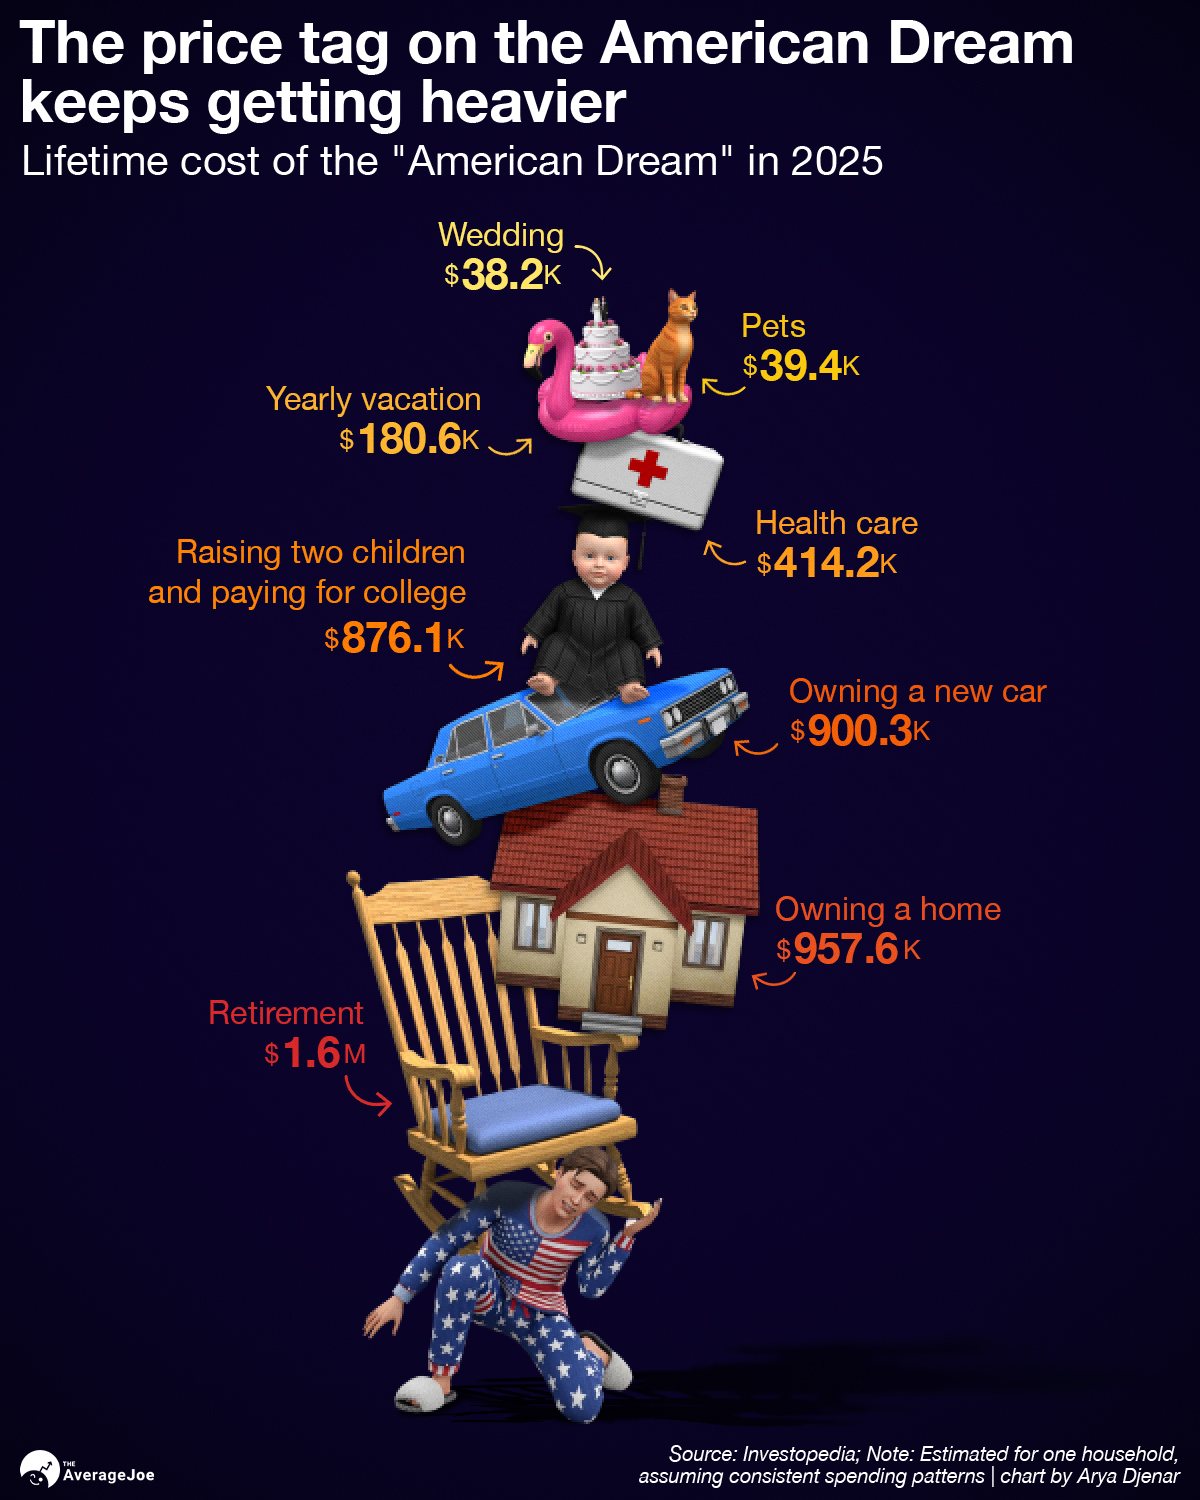
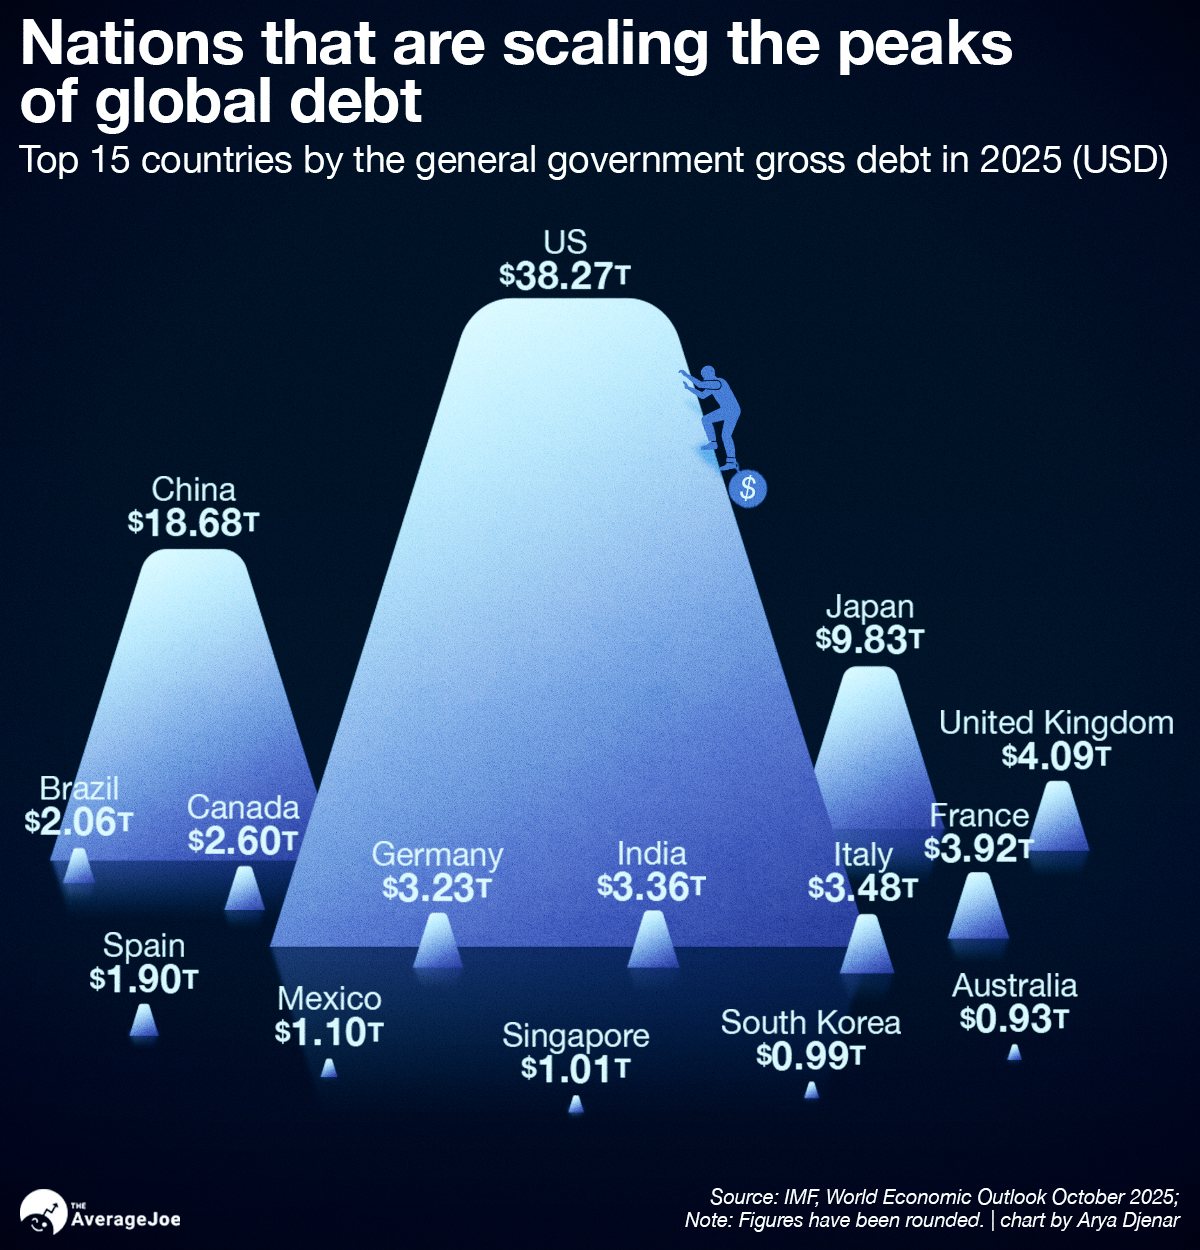
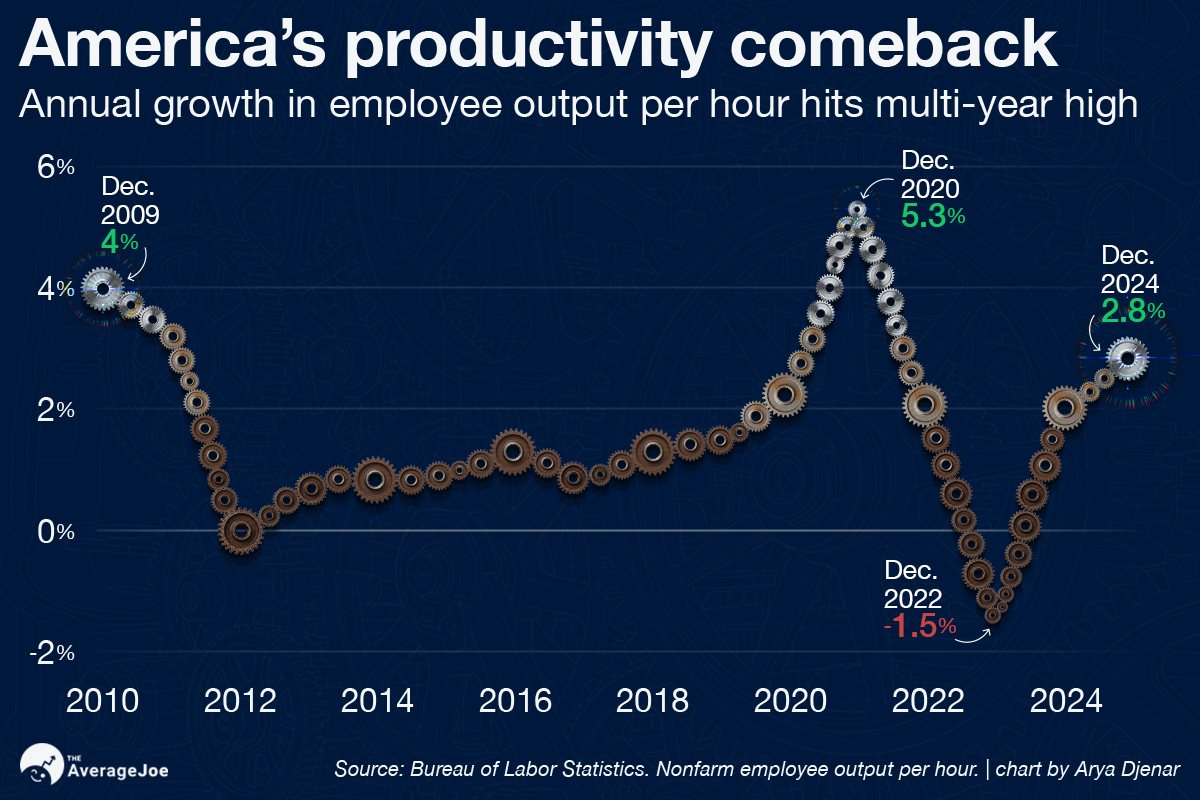
The message lives in the picture. The lifetime cost of an American life became a stack of things carried on one person's back. Government debt became mountains, with someone climbing the tallest. A productivity line became a chain of gears.
Every chart is built for phones at 1200px, carries one idea, and cites its source.
Where AI fits
I build them in Photoshop, finish them by hand and composite the pieces myself. AI helps with some of the elements, and I assemble them manually.
The result
The Sunday issue, built around the chart, gets about 4x the email readers of a normal day.
Readers regularly write in asking for more charts.